.png?fit=outside&w=1600&h=1391)
Dashboard development
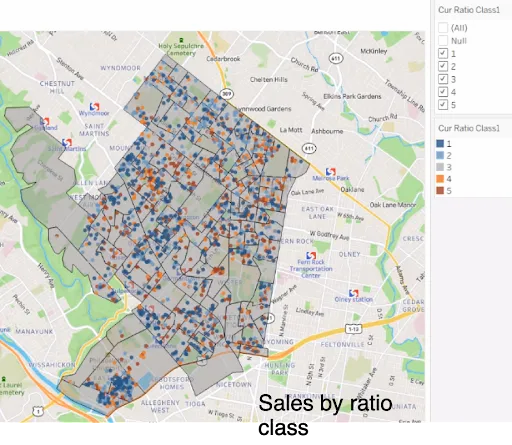
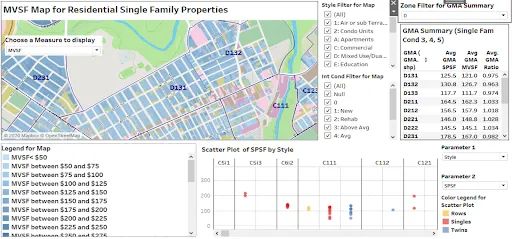
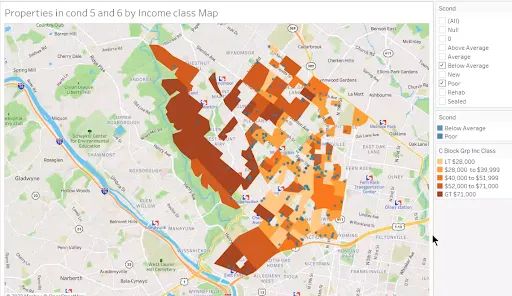
GIS dashboards are a great way to visually relate, analyze and look for patterns in your data. Interactive dashboards include maps, filters, selectors, charts and graphs that respond dynamically to user input.
I have used them to examine sales trends; analyze data quality; compare market values; examine equity; or change market area boundaries. How you use them is limited only by your imagination.
.png?fit=outside&w=1600&h=747)
.png?fit=outside&w=1600&h=925)