Kevin M. Keene
Racial and Social Equity in Assessments Part 1
There is a perception that many jurisdictions currently over-assess or overtax the poor and communities of color. There are many, especially in the academic community, who consider this statement to be true without argument.
This topic has been drawing a lot of interest in the assessment community. Some municipalities have already been the targets of studies alleging bias in assessments. Others should expect to be targets of such allegations. There are many opinions and a lot of material has been written about this subject and plenty of room for discussion remains. I present a different perspective, one that looks at bias in assessment not only as a social issue, but also as a complex systems problem. It is not my intention to contradict or disparage any of the work that has been produced or published on the subject. I hope to provide some insight and encourage discussion and engagement.
I’m writing this from my perspective as a mass appraisal modeler and director of more than sixteen major revaluation projects for the city of Philadelphia. I’m not an academic. I am a practitioner with over thirty years of experience. Early in my career, I was assigned to a new unit — Mass Appraisal and Analysis. At that time the office had no CAMA system. We were several years away from having computers for the staff. There was a mainframe system that gave terminal access to a very rudimentary set of data. It was obvious to me that the data collected was designed to support the cost approach, although the office purported to use the sales approach to value. The methods used to estimate market value were less obvious. It turned out that the valuation “process” amounted to
• Accounts were assigned to an Evaluator and
• Values were whatever the assigned Evaluator thought they should be
Needless to say, the system was extremely subjective and prone to bias for any number of reasons, ranging from poor data structure and quality to a complete lack of defined process and oversight. A fractional assessment system — where the assessment was a percentage of the estimated value — was in place. Very few people understood the true market value represented by the assessment, so there were no grounds for complaint.
Over period spanning decades, I was part of an ongoing effort to build a system that was more objective and fair. I created custom neighborhood definitions; built a CAMA system; created a sales file to support mass appraisal; instituted a system of sales validation; developed a catalog of regression models that are used to estimate values and promoted a well-documented process that improved transparency and public understanding of assessments. I took care to ensure that demographics were not part of the valuation process. This is not to say that the department achieved an end goal. Because there is still much room for improvement, this is more to say that anyone who has a plan and follows it can greatly improve equity in their municipality. Perfection is unachievable, but we can always do better.
Given my history, I was surprised when Philadelphia’s assessments were criticized for being biased against “communities of color” or “poor communities”. I purposely designed a system of defining locations for mass appraisal that was based entirely on sale prices for comparable properties and completely blind to demographics. We don’t know who lives in the properties. By our mass appraisal definitions, we have no “poor neighborhoods” or “minority neighborhoods”. How could a demographically agnostic system be biased? As it turns out, there are plenty of ways that bias can find its way into the assessment process.
This article will be divided into three installments. The first installment seeks to define the problem. We can’t solve a problem if we do not first define it properly. Are we asking the right questions? Do we truly understand the nature of the problem? A lot of analysis has been performed, but is the analysis meaningful? How do we define and create meaningful analysis? The second part of this article will examine the kind of analyses that we need to understand the problem and identify roots and sources. The third part of this article will suggest remedial actions and steps that can be taken to correct bias if it is detected.
I would like to acknowledge the Office of Property Assessment for the City of Philadelphia for allowing me to use a fictionalized version of their data files and geography to create the exhibits and illustrations that are included in this article. The data have been modified to aid the visualizations that are included, and do not reflect a true or current state of equity within that jurisdiction.

Looking at this problem, we see that it is much like an iceberg. There is a part of it that is visible from the surface — that which can be measured and analyzed. But there is much more below the surface. There is a level of human bias that is ever present in all phases or subsystems of the valuation process. These human biases are in turn often sourced to deeper systemic biases that run through the local real estate market and through society itself. If our desire is to determine if bias exists and root out the causes of bias, all three levels — statistical, human and systemic — must be considered.
Defining Equity
The first question we need to ask is “What is equity?”. The dictionary defines equity as “the quality of being fair and impartial”. We need to go a step further. In assessment we consider equity to be a state wherein a group of properties that share a given set of attributes have similar values for tax purposes. From a racial or social perspective, there should be no discernible systemic bias in the valuation process or in the resulting set of appraisals based on race, ethnicity, religion, income, age or any other demographic stratification.
A distinction needs to be made between equality and equity. With equality everyone gets the same thing. If we seek to correct an imbalance that creates a disadvantage for a certain group equality often does not solve the problem. In fact, it often makes the problem measurably worse. With equity everyone gets what they need so that a common goal can be achieved. An example of a valuation process that creates equality would be using a median value or value per square foot, perhaps modified by one or more other attributes, to assign values to all properties. By definition, the median value is going to overvalue half of the cases, and undervalue the other half of the cases. It may actually be fair for a very small number of cases, but everyone is treated equally. By contrast, an equitable valuation process will consider all attributes that effect price and calculate a value for each property based on the (possibly unique) combination of attributes present. Every property could have a different value, but in each case the value would reflect the attributes and market conditions that relate to that specific property. In a revaluation scenario, equality could be that everyone gets a 5% increase in value, regardless of whether they are currently overvalued or undervalued, resulting in even greater disparity. In an equitable revaluation along the same lines, undervalued properties would get an increase; overvalued properties would get a reduction and properties at the correct level of value would get no change.


From a systems perspective, equality is focused on process whereas equity is focused on outcome. How many times have we heard the phrase “equal under the law”, meaning that all parties have access to the same process, and witnessed the inequity that results when that process produces different outcomes for different groups pf people? The assessor is uniquely positioned to produce equity, because they have access to the best data, possess the best domain knowledge, and understand the history of valuation in our jurisdictions. Courts on the other hand tend to produce equality. For these reasons, the assessors’ office is the best party to proactively identify, isolate and correct systemic bias in assessments.
What Defines a Disadvantaged Community?
Rather than using the terms “communities of color” or “poor communities”, I prefer to use the term “disadvantaged communities”. While it is true that a lot of the discrimination that is commonly experienced, at least in the U.S., is based on race, ethnicity, or income there is also bias against religion; levels of educational attainment; political affiliation, sexual orientation, or ________ (fill in the blank). Even in municipalities that are racially homogenous, there are almost always groups that are considered to be less “desirable” than others. These groups usually do not have the political capital to direct or even influence decisions that are made by the jurisdiction. The “have nots” are at the mercy of the “haves”. Since it is very difficult to target specific properties or households for preferential or detrimental treatment, there must be geographic patterns of concentration that can be targeted. In assessment, it is easier to discriminate against neighborhoods than individuals. This is not to say that tax policy cannot be implemented that discriminates for or against individuals, but property assessment is principally an exercise in geography.
We should also not assume that all communities of color are poor, that other communities are wealthy, or that all communities of color are disadvantaged. However, if a disadvantaged community can be identified and geographically determined, tests for bias can be applied. For the purpose of this article, I will use examples of analysis from the viewpoint of race and income, but qualified study can be based on any division that can be identified by data and geographically determined.
Systemic vs Anecdotal Bias
There is a difference between observing isolated and unrelated instances of uneven assessment performance, or anecdotal bias, and systemic bias. In order to qualify as systemic, bias must clearly be
• Experienced almost universally
• By a demographically identifiable group
Finding one disadvantaged community that is performing inequitably is not enough to claim systemic bias. Bias against all or many such communities must be demonstrated in order to claim systemic inequity. Bias must be pervasive. Anecdotal bias may be the result of poor or uneven data quality, inadequate training for a small number of employees or the failure to isolate the attributes or forces that create variance in the local real estate market. This is not to say that anecdotal bias should not be remediated when discovered. However, we must recognize that the steps that need to be taken to correct anecdotal bias are different than those that are needed to correct systemic bias, and plan accordingly.
Keep the focus on Assessments
In discussion of this topic there is usually a lot of talk about bias in housing or in the local pricing structures of the real estate market, and assessments get tossed in with all of the other issues. It is easy to conflate assessments with taxes, or to assume that bias in the local pricing structure is causally related with bias in assessments. Are local housing markets subject to bias? If there was a game in a casino that took bets municipality by municipality, I would bet as much as possible on “yes” and probably bankrupt the house in short order. Many real estate markets are segregated by design, with legacies of bias that can be traced back to their foundations. Local pricing structures are frequently linked to demographics, but bias in housing is not the same as bias in assessments. Bias in tax policy is not the same as bias in assessment either.
We should all be familiar with the formula:
Property Tax = Assessment * Tax or Millage Rate
In contemporary practice, this classic formula more often takes the form of:
Property Tax = Assessment * Tax or Millage Rate + or — (Abatements; Exemptions and circuit breakers)
The assessment office typically has control of only one part of the formula. If assessments are biased, then property taxes will also be biased, but unbiased assessments are not proof against bias in property taxes or bias in the protective relief measures that are enacted as safeguards for taxpayers. Assessment equity is not the same as tax equity. Many studies focus on assessments instead of taxes because assessments are typically public record, but tax bills are not.
A challenge is avoiding the distractions of trying to correct the legacies of bias and discrimination in our housing markets and tax policies and stay focused on assessment performance.
Here are some examples to consider.
Redlining is the practice of discriminate lending practices that exclude neighborhoods that are considered undesirable. Making mortgages unattainable in communities of color or poor communities contributes to the inability of persons in those communities to accumulate wealth. This is an example of a redlining map for the city of Philadelphia.
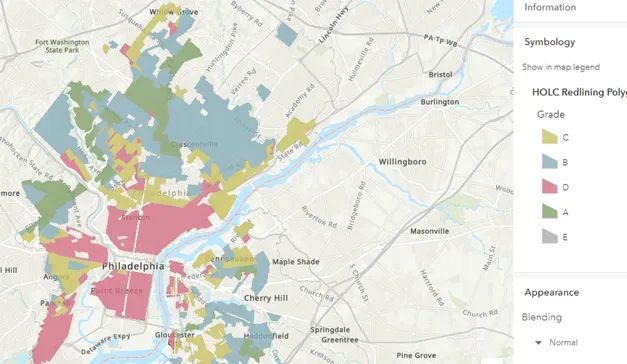
This practice discriminates against communities of color in the inner city and has a causal effect on keeping prices and values low in those areas.
Predatory speculation occurs when buyers with cash offer people who do not know the true value of their property “easy” money for their homes. It frequently occurs in disadvantaged communities. The speculator’s profit margin is usually a function of how much below market value they are able to acquire the property. The practice is considered to be predatory because it relies on a lack of knowledge on the part of the seller, taking advantage of those who do not have access to market information.
Restrictive covenants are clauses that are written into deeds to prevent the sale or rental of properties to minorities. They are not uncommon in communities across the nation. Racial deed restrictions became common after 1926 when the US Supreme Court validated their use. An owner who violated them risked forfeiture of their property.
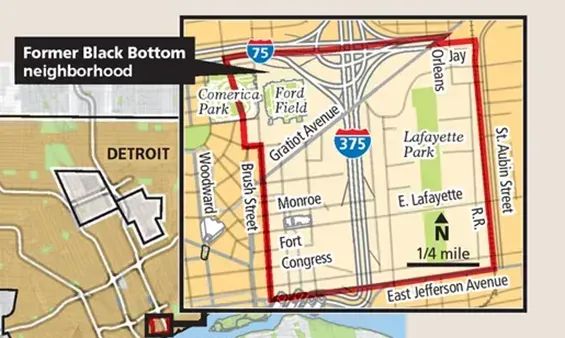
Governmental actions have also served to create inequity in housing markets. These actions include using eminent domain to demolish communities of color for public works. This map shows two freeways that were built in Detroit that served to isolate or demolish primarily black owned business districts and entertainment districts.
Other examples include not building sewers or infrastructure to deliver clean water or adequate waste removal to certain communities.
There have been recent documented cases of bias in the fee appraisal industry. In more than one example a black family has received an appraisal. After removing all evidence, including pictures, artwork etc. of their ownership and getting a white family to stand in for them to meet another appraiser, these same families received higher estimates of value.
What do all of these examples have in common? None of them are about assessments. As assessors we need to stay tightly focused on the issues that involve mass appraisal. Assessors are not typically responsible for the dynamics of the local pricing structure. Assessors do not determine taxes or create tax policy. Assessors do not set tax rates. The assessment function is to estimate market values. At the end of the day, it doesn’t matter why people pay what they pay for properties, only that the estimates of value are made without favoring one group over another.
Overview of the Problem
Visual aids are very helpful in understanding the problem of bias in assessments. In fact, it is difficult to understand the problem without a visualization. Here is a statement and visual representation of the problem: There is a general perception that property assessments are biased against communities of color and poor people. It is possible that the perception — not the underlying truth — is the problem. In the face of a strong perception, the truth of a matter may become irrelevant. Using this diagram as a guide, let’s walk through the elements one by one. Numbered elements in the diagram correspond to the numbered bullet points.
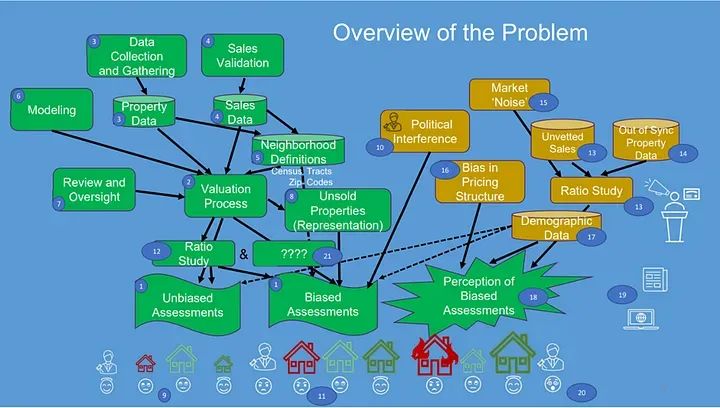
Let’s start by looking at the valuation process.
1. Assessments can be either biased or unbiased. There are industry benchmarks for the level of assessment and the relative uniformity of assessments. Ideally, predicted market values should closely replicate observed sale prices, with little variation in the degree to which those values are related to price. Assessments are considered to be unbiased if measures of uniformity are consistent throughout the universe of sales data, and residuals (the difference between the predicted price and the observed price — a fancy way to say “errors”) are randomly distributed. Assessments may be considered to be biased if errors are not randomly distributed, or can be correlated with specific locations; low or high prices; or shown to clearly favor one subset of properties over another. It is a practical impossibility to achieve a perfectly distributed set of assessments, however those that fall within recognized industry standards can be considered to be unbiased.
2. Assessments are the result of a valuation process, and there are many different valuation processes. Every county or municipality will create a unique valuation process, however all valuation processes will have certain elements or subsystems in common. These typically include:
3. Data collection and gathering, which leads to databases of property data
4. Sales validation, which determines which sales are indicators of the value of similar properties and also captures attributes of properties at the time of sale and leads to a database of sales data.
5. Sales and property data may be used to create neighborhood or location definitions. These should not be based on demographic data. Some municipalities use census tracts or zip codes to delineate neighborhoods. If so the results will almost certainly be biased along demographic lines because zip codes and census tracts are rooted in demographics.
6. Modeling is the logic and mathematics that convert sales, income, cost and property data into predictions of value. For purposes of this discussion, a model is any repeatable process that results in a value prediction.
7. Review and oversight, which includes examining the values produced by the model or by the valuation process and making corrections or revisions, as well as resolution of complaints and informal or formal appeals by property owners.
8. The results of the evaluation process are applied to all properties including those that sold as well as those that did not. For a given revaluation project In Philadelphia typically between 6% and 8% of the properties were, sold leaving the vast majority of properties in the unsold properties group. Sales are never evenly distributed, so there may be properties that are not directly represented by sales. This leaves plenty of room for assumptions that may lead to errors. One group of 10 sales might represent a group of 300 properties. Another group of 10 sales might represent 50 properties. The magnitude of errors can be greatly affected by the representative relationship between sold and unsold properties.
9. If assessments are unbiased, the pool of over-assessed properties will be small and randomly distributed, so that many homeowners in this group may not be aware that they are over-assessed. The pool of under-assessed homeowners will also be small and randomly distributed. In my experience many of these homeowners will know that they are under-assessed but will not complain. The large pool of accurately and fairly assessed homeowners will typically go about their lives without any feeling about their property assessments. The municipality will be satisfied because very few people are complaining.
10. Most assessment offices exist within the political framework of the county or municipality and do not operate in a vacuum. If there is direct political interference in the valuation process assessments will necessarily be biased. Political interference may be overt or subtle but can also be benign or well intentioned.
11. If assessments are biased, there will be larger pools above over-assessed and under-assessed properties or homeowners and the effects will not be randomly distributed. There will be clear winners and losers. The winners may be quite happy. The losers will be unhappy. The municipality or county should be unhappy as well.
Now let us consider these subsystems and processes. Each of them is driven by humans, and humans have biases. There are opportunities for bias to be introduced through any of these subsystems, and if even one of them infects the valuation process with bias, then the resulting assessments may also be biased. Every one of these subsystems or processes must be without bias in order for the assessments to be unbiased. Viewed from this perspective, we can easily understand how difficult it is to produce a set of unbiased assessments. The deck is really stacked against the assessment office.
How do we determine if assessments are biased or unbiased? Whether we use the sales approach, cost approach or income approach, the resulting estimates of market value are predictions of a sale price.
12. We typically conduct a ratio study which is a statistical process that compares the level of assessment and uniformity to observed sale prices across neighborhoods, types of buildings, price levels or many other ways to stratify properties. A serious limitation is that ratio studies can only be run against the file of sold properties. They tell us little or nothing about the large pool of unsold properties. Also consider that in most ratio studies each sale carries equal weight, so the degree to which a sale represents a greater or lesser number of unsold properties is not recognized.
Now let’s examine how the perception of bias arises.
13. Along comes an outside analyst. They are probably an academic, or perhaps a community activist. They have two things that the assessors’ office does not have — credentials and an audience. They are telling the world that assessments are extremely and systemically biased. They came to this conclusion by running a ratio study, just like the assessor’s office does. Well, not exactly. You see they do not have access to the same data that the assessors’ office has. They are using publicly available data. This includes sales data that has not been vetted to remove transactions that do not meet prescribed tests for being indicators of typical market activity and are not useful predictors of the prices for similar properties.
14. They are also using only current property data — both physical attributes and market values — not data that describes the conditions that were present at the time of sale. For example, the file includes a sale from 2018 for a property in poor condition which sold for $100,000. The property has been subsequently rehabbed and has a current value of $200,000. The data file shows that the property is a rehab with a value of $200,000 and a sale price of $100,000. From their perspective, it looks like the property is significantly overvalued. In the assessors’ data file, the sale price of $100,000 is for a poor condition property, for which the prediction of value might have been $102,000. See the problem? The analysis is correct, but the data is flawed.
15. Additionally, this analyst is not familiar with the dynamics of the local housing market and therefore does not recognize the “noise” that is inherent in any market. The entire appraisal industry is predicated on the premise that the value of a property is linked to its attributes; that the value of a property can be predicted if the attributes of the property are known and can be compared to the attributes of similar properties that have sold. If I know the attributes of a property, I can predict a value. Are there cases where prices are not as dependent on attributes as they are on other factors that may not relate to the property at all? What happens when the relationship between price and attributes is broken? When observed prices are not based on the attributes of the property, variance from predictable prices arises which cannot be explained.
Consider how often we see identical properties next door to one another that sell at the same time but at different prices. The difference may be explained by the relative negotiating skills of the buyers and sellers — something that will never be captured in our data files. Sometimes variance in price may be due to the presence of an attribute that is so unique that it is not captured in our data. Even if that attribute were in the data, it would appear so infrequently that it would be statistically insignificant. The relationship between price and attributes tends to breakdown with greater frequency in the low and high ends of the price spectrum. A greater percentage of sales in the low-end and high-end price ranges should therefore be invalidated in the sales vetting process.
16. This analyst is usually aware of bias in the local housing market — redlining; restrictive deed covenants; predatory speculation; infrastructure problems and others — and assumes that those biases have a causal relationship with assessments.
17. The analyst examines the results of the flawed ratio study by incorporating demographic data into the analysis. Demographic data such as ethnicity, income, age, and levels of education should have no place in the valuation process. Considering that much of the “noise” in the market occurs in communities of color and in poor neighborhoods, cross correlation of ratios with demographic data further distorts the emergent picture. Even so, the assessor’s office must be prepared to examine performance through the lenses of demographics if the arguments are to be countered. This can be tricky, as it is easy to confuse correlation with causality.
18. All of this converges to create a strong perception, seemingly based in fact, that assessments are biased.
19. Articles and reports are published and presented to the public.
20. This results in large groups of people who believe that they are subject to unfair treatment by the county or municipality. The municipality is concerned because the very real threat of a class action lawsuit could result in significant loss of revenue. Even worse, the remedy that could be imposed by a court may actually fail to resolve the problem. The cure could be worse than the disease.
A recommendation for the assessment industry:
21. In addition to conducting ratio studies to examine the health of assessments, there are other meaningful analyses that need to be performed. This is a space where innovation is needed. The assessment industry needs to go beyond analysis of the relationship between sales and market values and consider activity levels; representation of unsold properties; comparative market value rates and other measures of assessment equity and performance. We need to use Root Cause analysis and other “fuzzy” tools to identify the sources of disparity in assessments. When we engage in the bias discussion, we should ensure that all parties in the discussion are addressing the same issues from a common perspective. Only then can we identify both the presence of bias in the valuation process and trace any observed bias to its source so it can be remediated.
Only when I made this diagram was I able to see that I was not addressing the correct question. When presented with a report that assessments in Philadelphia were biased, I went directly to all of the elements on the left side of the diagram — the valuation process and subsystems — without considering the most important aspects of the discussion. What was generating the perception of bias? How were qualified analysts coming to a conclusion of bias? I had to identify the elements on the right side of the diagram in order to frame a discussion that had any chance of allowing a rational approach to identifying and resolving the issues.
Valuation process
The path to equitable assessments starts with a process that limits subjectivity and opportunities to introduce bias, but also requires the use of methods and techniques that do not consider demographics in the determination of market values. The valuation process should be well documented and transparent, relying on objective standards and processes to the greatest possible degree.
Many jurisdictions use locations that are based on demographics — census tracts and zip codes — and may even include demographic data, such as crime; income; ethnicity; and educational attainment in the process of determining value. Biases in the coding of attributes can also contribute to inequities in assessment.
The assessment process should avoid the use of demographic attributes or data at any point in the valuation process. Neither should the assessor rely on legacy information that may be subject to bias, such as redlining maps. If this can be accomplished, the resulting process should be resistant to systemic bias, although each valuation subsystem may be subject to the biases of the humans who interact with that system. There is, however, an appropriate place for demographic data in the analysis process.
Sales Data
The assessment office has many functions. Principal among them is the promotion of public records that disclose information relating to the ownership of and, except for a few non-disclosure states, the consideration paid for every parcel in the jurisdiction. Publicly available data files are structured to support this function. These files typically list only the most recent deed transaction for each parcel. Only the most rudimentary validation is performed, such as disclosure of sheriff sales, sales between related parties, nominal considerations, or blanket transactions. These conditions are usually contained in information in the deed. Public data files may contain information about some attributes of the property. These are usually current attributes, not attributes as they existed at the time of sale.
The assessment office also bears responsibility for the mass appraisal of all properties, using a variety of methods to promote fair and equitable market values based on the location and other attributes of each parcel. This function requires an entirely different type of sales file, one that includes multiple transactions for each parcel where those transactions have been thoroughly validated to include only transactions that are useful indicators of the value of similar properties and attributes as they existed at the time of sale.
Each of these files is necessary but only serves the purpose for which it is intended. Neither one should be used as a substitute for the other. Publicly available data files should not be used to determine the equity of assessments from any perspective, yet many analysts use these files to support the perception of biased assessments. At the minimum the analyst should use appropriate data files. The best source of properly vetted and maintained data is the assessment office. But if the analyst is alleging misconduct on the part of the assessment office they be resistant to using a file that the Assessor gives them. Some analysts will use data files from multiple listing services or other sources that are electronically available, however, we must recognize that many transactions that occur in communities of color or economically disadvantaged communities are not represented by real estate professionals, resulting in an implicit bias in using those files.
Analysts should only utilize files of transactions that have been subject to a rigorous sales validation process. Sales validation consists of two parts:
• Coding transactions as either valid or invalid as indicators of value for comparable properties
• Capturing the attributes or characteristics of a property at the time that it was sold.
The purpose of a robust sales validation process is to create a pool of sales that are good indicators of the value of similar properties. This goes far beyond a simple determination of a transaction status as “arms-length”. Sales validation should seek to eliminate sheriff sales, estate sales, sales between related parties, bids, foreclosures, sales to predatory speculators, sales involving atypical financing, sales where either the buyer or seller are under duress or any other transactions that do not represent normal market activity between willing and knowledgeable parties. Sales validation is a complex process which is not easily automated, and unfortunately, is a subjective process that is especially susceptible to human bias.
Many counties that rely on the cost approach may not have created a sales file that meets these criteria. Even if the sales approach is not the primary driver of the valuation process, sales will be used to measure assessment performance. Ratio studies are easily distorted by including transactions where the attributes of the property at the time of valuation are different than the attributes that were present at the time of sale.
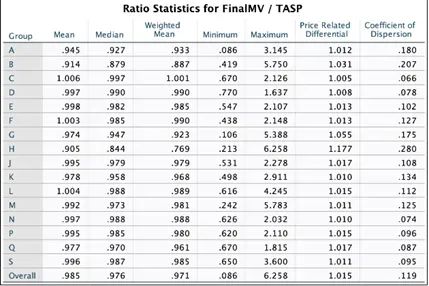
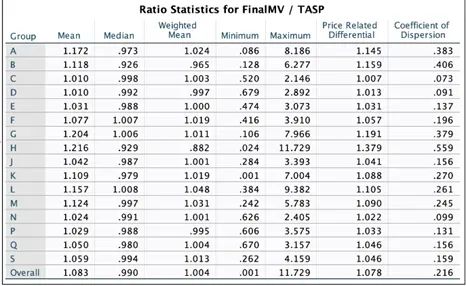
These ratio study results use the same sales data file. The ONLY difference between the two is that transactions where the attributes of the property at the time of valuation are different than the attributes that were present at the time of sale have been removed from the results on the left, but not in the results on the right. Using the results on the right, an analyst could easily conclude that over-assessment is common and that both horizontal and vertical equity are poor. This demonstrates why it is so important to use a properly screened and validated data source when conducting analysis of assessment performance, and why it is strongly recommended that a well validated file of transactions that meet these criteria is created and used to evaluate assessment performance.
Adjusting sales data for time
To have a sufficient number of transactions to support reasonable analysis the analyst most often use several years of sales data. Prices must be adjusted for time to normalize data as of a common date. Many analysts use consumer price indexes or housing indexes to adjust sales for time. The problem with these methods is that they often result in adjustments that are linear and too general to support reliable analysis. Accurate time trending is a process that requires extensive knowledge of the local markets and sub-markets. Frequently there are multiple time trends in play within one jurisdiction. Some areas or types of property are simply “hotter” than others.
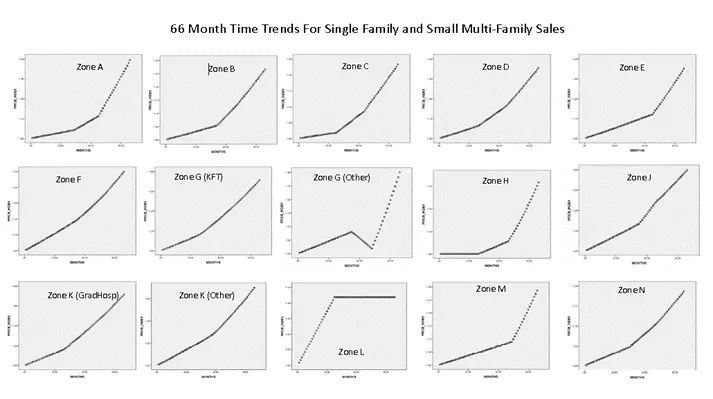
This chart shows the 66-month time trends for single family properties from different parts of Philadelphia. Notice that no two are the same and none are linear. If we were to use a linear trend (by drawing a straight line from the beginning point to the end point), it is apparent that in all cases we would be correct at the beginning and correct at the end but wrong at every point in between. We can also see that use of a single time trend for all properties cannot possibly yield accurate results. Consumer price indexes include food, clothing, gas, guns, and butter, which all change at different rates and probably not in the same direction or degree as real estate. Housing indexes are often reliable only at regional levels and are not granular enough to trend the prices across submarkets. Therefore, use of generalized indexes is not recommended.
Market Noise
Market noise results when observed prices are not dependent on the attributes of the property, but on irrational, unpredictable or unquantifiable actions in the market. It can also be caused by missing or inaccurate data. It is vital that the analyst is able to recognize and remove as much noise as possible from the data. Here are some examples and sources of market noise:
• Every market has areas or groups of properties for which it is difficult to predict price or value because observed prices are not based on the attributes of the properties, but on other market dynamics.
• Some groups of properties may not be represented by sales data.
• Accurate coding of attributes may be more difficult, inconsistently performed or not available in some areas or for certain groups of properties. These cases must be recognized and either removed from or given special consideration in analysis.
• Disadvantaged communities will have a disproportionate share of transactions that should be invalidated. Data quality and completeness may often be less reliable among these transactions.
• Sheriff sales, bids, foreclosures, and sales to predatory speculators are much more common in the lower end of the price spectrum.
• Variance in price for unique attributes that are not captured in the data files, such as expensive custom features, is more common in the high end of the price spectrum.
• There should be no expectation that the distribution of invalidated transactions should be constant throughout the inventory.
Quick Recap
There is a perception that assessments are biased. This perception is often based on:
• Sales data that is not appropriate for the analysis.
• Characteristics and market value data that is not representative of properties at the time of sale.
• No significant sales vetting or validation.
• Imprecise time trending methods.
• A ratio study that is based on flawed data where the market value and sale price are not necessarily connected.
• Market noise that has not been recognized or removed from the analysis.
• Not considering if unsold properties are adequately represented.
• Comparisons that are based on prices or values. It is better to normalize comparisons by using price per square foot or value per square foot.
• Actual bias in the assessments
Perhaps the most difficult challenge for the assessor is that defense is based on proof of the non-existence of bias. While it is possible to empirically prove the existence of a thing, it is much more difficult to prove that a thing does not exist.
Let’s re-examine our Iceberg diagram.
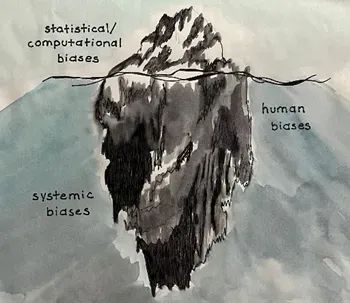
Above the surface are the things we can test and measure using ratio studies.
The test for bias is that properties that share similar sets of attributes have similar values for tax purposes and there is no discernible systemic bias in the valuation process or in the resulting set of appraisals based on race, ethnicity, religion, income, age or any other demographic stratification.
If enough noise is removed from the data, AND all properties that share the same attributes have close to the same values AND any variance in value can be traced back to differences in specific attributes — not demographics — AND the level of assessment is similar between various groups of properties — then one can safely say that assessments are not biased.
Just below the surface are the human biases that are present in the system.
If either anecdotal or systemic bias is indicated by our tests and measurements, deconstruction of the valuation process and all subsystems is required to determine if and how those biases are impacting the system. This is where root cause analysis is needed.
Anecdotal bias will most likely be traced back to the actions or decisions of specific people. Depending on how high up in the organization the human biases are impacting the system, it is possible for human bias to create systemic bias.
Deeper down are the systemic causes of bias. These will include the valuation process itself, the actions of people that direct the process, and the presumptions that are made within the process.
I hope that I have created a clear picture of what it means to have assessments that are racially or socially biased. I also hope that I have illustrated the many ways the argument that assessments are biased can easily go astray. Take a moment to the consider the degree of assessment bias that may be present in your jurisdiction. Is it more likely to be systemic or anecdotal? Is your valuation process objective? Well documented? Transparent? Are demographics embedded — either directly or indirectly — in the valuation process? Are your data files readily available to independent agencies?
In the next installment, we will examine frequently used analytics and suggest others that may be helpful in identifying if there is bias in the assessments.
About the Author

Kevin Keene served the City of Philadelphia for over 30 years as a Real Property Evaluator; Mass Appraisal Analyst; Real Property Supervisor; GIS Manager; Modeling Director and Director of Mass Appraisal and Analysis. He personally designed and directed over sixteen major revaluation projects. He has trained appraisers, modelers and analysts, and has been a frequent presenter at IAAO and URISA conferences.
In his semi-retirement he is the principal at Keene Mass Appraisal Consulting (keenemac.com), offering a variety of Mass Appraisal and educational services. His primary passions are promoting assessment equity, community activism and enjoying life with a loving wife and two adorable dogs.
267.307.6071
Kevin@keenemac.com